Updated August 2026
Here's the short version. There's a lot more to choose from in Auburn and Opelika than there was last summer, and homes are sitting a little longer. The market didn't crash, though. It loosened up. Those are two very different things, and the difference changes what you should do next.
I pulled the June 2026 listing data for Lee County, which covers Auburn, Opelika, and everything in between, so you can see exactly what I'm seeing.
The Bottom Line
- 975 active listings in Lee County, up 27% from June 2025. Buyers have real choice again.
- Median list price is $412,500, down 3.1% year over year. Read the next line before you celebrate or panic.
- Price per square foot is $199, essentially flat (down 0.5%). The typical listed home is 7.9% smaller than last year. That size shift more than accounts for the price "drop."
- Median days on market is 56, up from 50. Six extra days.
- 35.3% of active listings have taken a price cut, up from 32.6% last June. Overpricing gets punished quickly right now.
- The 30-year fixed averaged 6.66% the week of July 30, 2026, still a hair below where it sat a year earlier.
The June 2026 numbers at a glance
Metric (Lee County) | June 2026 | June 2025 | Change |
|---|---|---|---|
Median list price | $412,500 | $425,900 | -3.1% |
Median list price per sq ft* | $199 | $200 | -0.5% |
Median listing size | 2,013 sq ft | 2,185 sq ft | -7.9% |
Active listings | 975 | 768 | +27.0% |
Total listings (incl. under contract) | 1,125 | 920 | +22.3% |
New listings that month | 342 | 368 | -7.1% |
Median days on market | 56 | 50 | +6 days |
Listings with a price cut | 344 | 250 | +37.6% |
*Price per square foot covers the Auburn-Opelika metro area. Every other row is Lee County. All figures are Realtor.com residential listing data published through the Federal Reserve Bank of St. Louis (FRED), June 2026.
Inventory is up 27%, and that's the real story
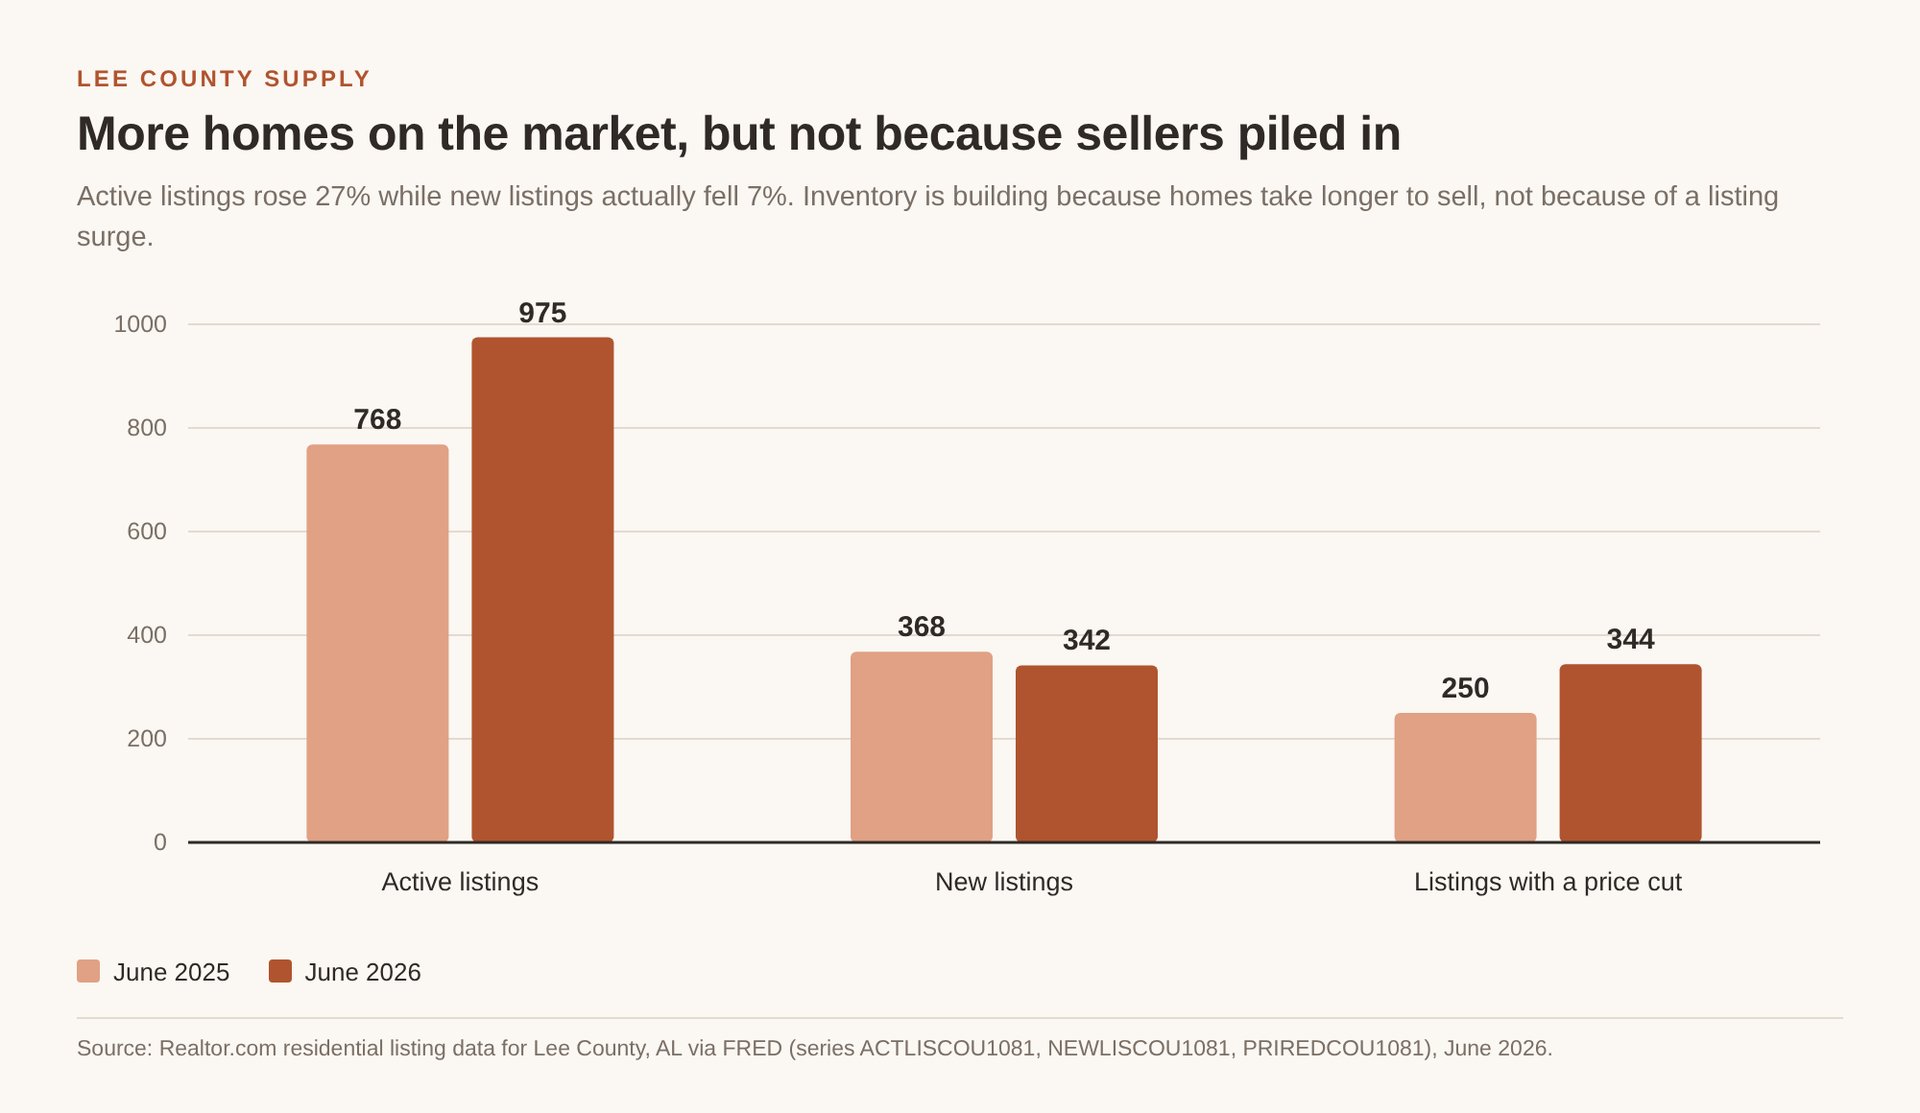
Here's what surprised me. New listings actually fell 7.1%, from 368 to 342. Sellers didn't flood the market at all. Inventory grew because homes are staying on the market longer instead of clearing out. Supply is stacking up, quietly.
For perspective, June 2019 had 866 active listings here. Lee County now sits above the last normal pre-pandemic summer, something that hasn't been true since before 2020.
If you're buying, this is the friendliest set of options Auburn and Opelika have offered in a long while. You can tour five homes in a weekend instead of racing to be first through the door on the only one in your range.
Prices didn't really drop. The houses got smaller.
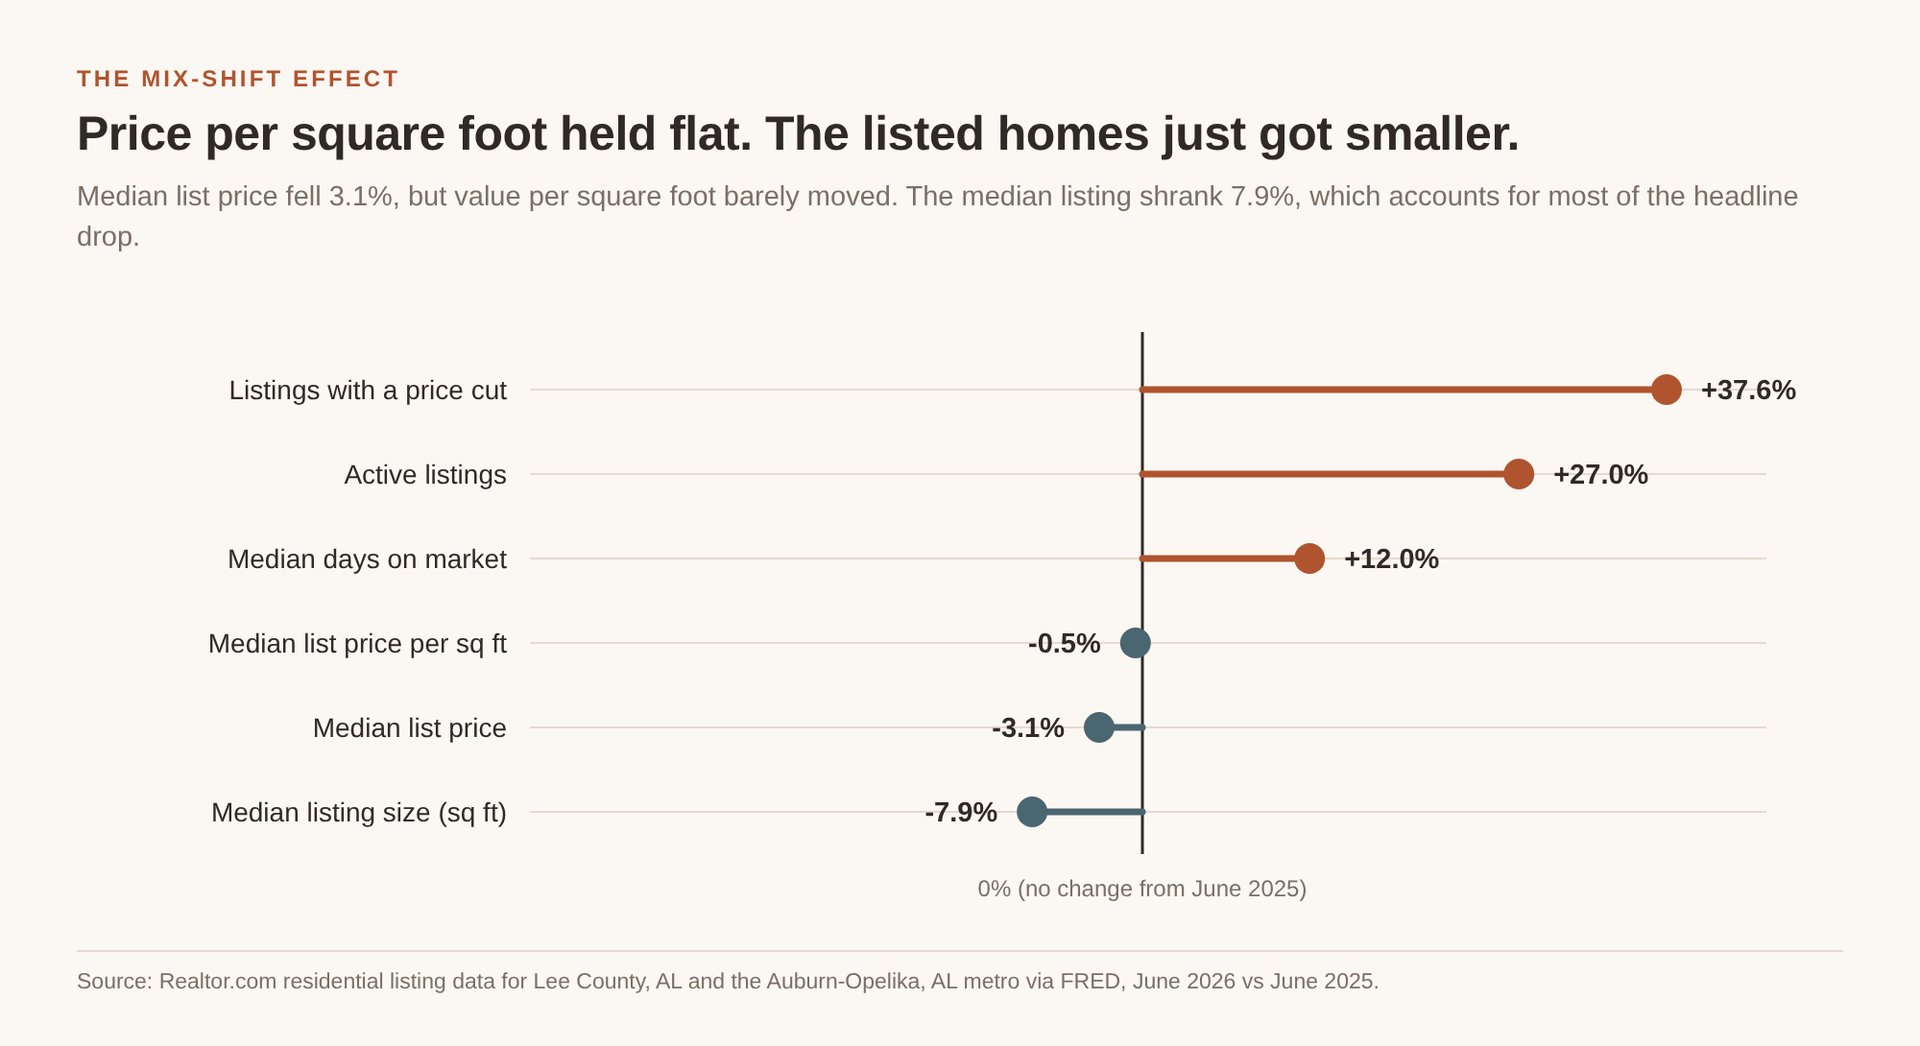
The median list price fell 3.1%. But the median price per square foot in the Auburn-Opelika metro went from $200 to $199. Per foot, buyers are paying essentially what they paid last June.
What actually moved was the size of the homes being listed. The median listing shrank from 2,185 square feet to 2,013, down 7.9%. Smaller, more affordable homes now make up a bigger share of what's for sale. On its own, that 7.9% size shift more than accounts for the 3.1% price decline. The mix changed. Your house didn't lose 3% of its value.
Two caveats, because I'd rather you have them. The per-foot figure covers the whole Auburn-Opelika metro, while price and size are Lee County. And a median price divided by a median size isn't the same thing as a median price per foot. The direction here is solid. Treat the exact split as an estimate.
Here's why it matters anyway. If you own a 2,800 square foot home in Moores Mill or a newer build off Cary Creek, headlines about falling Auburn prices don't describe your house. Per foot, values in this metro have held. What changed is the competition and the pace.
I'd still want to look at your specific street and floor plan before saying anything firmer. Neighborhood-level movement varies a lot around here.
Homes are taking 56 days, and a third have cut their price
Median days on market went from 50 to 56. Six days. It's a real shift in tone. Homes in June 2019 took 62 days, so listings here still move faster than in the last normal market.
The price-cut number is the one I'd pay closer attention to. In June 2026, 344 Lee County listings had reduced their asking price, up 37.6% from 250 a year ago. Against 975 active listings, that's 35.3% of the homes actually available. Same math a year ago gave 32.6% (250 of 768), and in June 2019 it was 18.0% (156 of 866).
Read that as a pricing problem. More than a third of sellers came out too high and had to come back down. Every one of those cuts started as a house that sat.
If you're selling in Auburn or Opelika
Your first two weeks are the whole ballgame. With 975 competing listings, buyers see everything, and they notice when something's been sitting.
Three things I'd focus on.
Price it right the first time
A price cut in week six costs more than pricing correctly in week one, because by then the listing looks tired. The 344 sellers who cut in June mostly learned that the expensive way.
Make the photos and prep count
When a buyer has real choice, presentation decides which five homes make their tour list. I'm a certified interior decorator, and I'll tell you honestly, this is the cheapest leverage you have.
Plan for eight weeks
Build your move around 56 days plus closing, and you won't feel like something's gone wrong at day 40.
Also worth knowing: online estimates are a starting point, not a valuation. They don't know your kitchen, your lot, or what closed two streets over last month.
If you're buying in Auburn or Opelika
You have leverage you didn't have in 2024, and it's specific.
Ask how long a home has been listed. Ask whether it's already reduced. A house that's been sitting 70 days with one cut behind it is a very different negotiation than a fresh listing in a tight pocket of Auburn.
Ask for repairs and closing help. In a market where more than a third of sellers have already blinked on price, plenty will move on terms too.
Still, plenty of listings won't budge. Well-priced homes in the school zones and lake coves people want keep moving, and they keep drawing competition. Choice and desperation are different things.
Wondering what your budget actually buys here? I broke it down price band by price band in what your money gets you in Auburn, Opelika, and Lake Martin. It pairs well with this update. These numbers tell you when, and that one tells you what.
Where mortgage rates sit right now
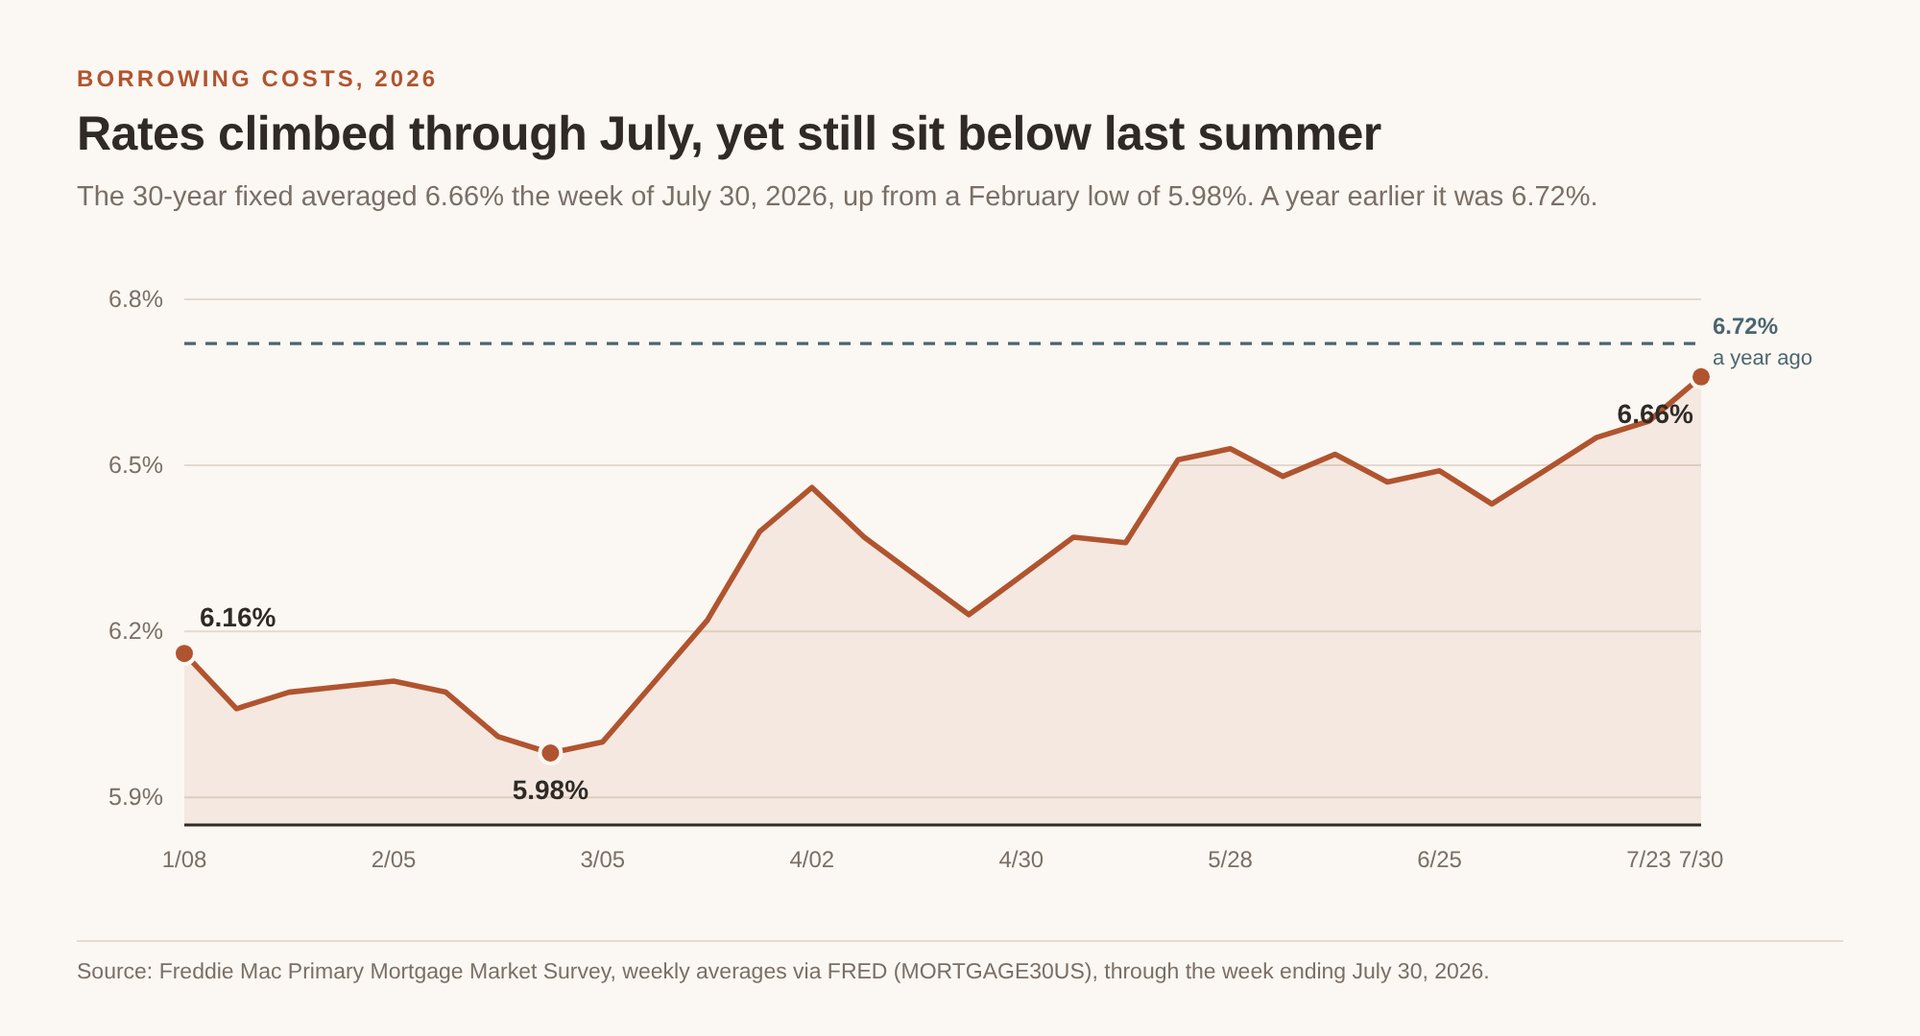
July alone moved it from 6.43% to 6.66%, about a quarter point in four weeks. Enough to notice on a monthly payment.
The context that gets lost: a year ago, the week of July 31, 2025, the same average was 6.72%. So despite the summer climb, borrowing costs sit slightly below where they were last summer. Inventory is what changed in this market, not rates.
I don't forecast rates, and I'd be careful with anyone who does. What I'd do instead is get a real pre-approval so you know your actual number, not a rounded internet estimate.
Why Auburn-Opelika holds up better than national headlines suggest
Local demand here doesn't track the national story, and there's a concrete reason.
Auburn University enrolled 35,172 students in Fall 2025, up about 3% year over year, with 28,953 undergraduates. That's steady, growing pressure on housing near campus, and it feeds a rental and second-home market most Alabama towns don't have. If you're weighing that side of the market, I ran the numbers on renting versus owning a condo near Auburn separately.
That doesn't make Auburn immune to anything. It does mean the demand floor here is sturdier than a national inventory chart implies. Slower still means moving.
Questions I'm getting this month
Should I wait for prices to drop more?
If you're waiting on a broad Auburn price decline, the per-square-foot data doesn't support that expectation yet. Values have stayed flat. Waiting mostly costs you the selection you have right now.
Is this a bad time to list?
It's a bad time to list high. Homes priced right are still moving in under two months.
Are Auburn and Opelika the same market?
Not really. Opelika generally gives you more square footage per dollar, and Auburn carries a premium for proximity to campus and downtown. The county numbers above blend both, which is exactly why I'd rather run your specific area than quote you a county median. My price-band breakdown of Auburn, Opelika, and Lake Martin shows that gap in detail.
Do these numbers cover Lake Martin?
No. Lake Martin sits in Tallapoosa and Elmore counties, outside every figure on this page. The lake is its own market with its own seasonality, and I track it separately.
Let's talk about your actual situation
County medians are useful for orientation. They're terrible for decisions. Your street, your floor plan, your timeline, and what sold nearby in the last 60 days matter far more than a number covering all of Lee County.
If you're thinking about buying or selling this fall, reach out at (334) 332-4002 or [email protected]. I'll pull the comps for your specific pocket of Auburn, Opelika, or Lake Martin and tell you straight what I think, even when it's "wait." I'd love to help.
Methodology and disclosures
The listing figures here come from Realtor.com residential listing data for Lee County, Alabama and the Auburn-Opelika, AL metro area, published by the Federal Reserve Bank of St. Louis (FRED), retrieved August 3, 2026. June 2026 is the most recent month available. Mortgage rates are Freddie Mac's Primary Mortgage Market Survey weekly average. Enrollment is the latest official Auburn University figure, Fall 2025.
Two things to know about geography. Price per square foot is a metro-level series covering Auburn-Opelika; every other figure is Lee County. And Lake Martin sits in Tallapoosa and Elmore counties, so none of these numbers describe the lake market.
One honest caveat on the prices themselves: these are listing prices, meaning what sellers are asking, not closed sale prices. They're a reliable read on supply, pace, and pricing pressure. They aren't a substitute for closed-sale comps on your home. Every percentage above is calculated from the figures shown in the table.
Nothing here is a comparative market analysis or an appraisal, and online estimates are a starting point only. For a real valuation, ask me for a CMA at (334) 332-4002 or [email protected].
Amy Cotney is a licensed REALTOR® (AL Lic# 108235) and Marketing Director with ROOTS Real Estate Investment Development in Auburn, Alabama, serving Auburn, Opelika, Lake Martin, and Lee County.
Sources
- Median Listing Price in Lee County, AL (MEDLISPRI1081), Realtor.com via FRED, June 2026
- Housing Inventory: Active Listing Count in Lee County, AL (ACTLISCOU1081), Realtor.com via FRED, June 2026
- Housing Inventory: Total Listing Count in Lee County, AL (TOTLISCOU1081), Realtor.com via FRED, June 2026
- Housing Inventory: New Listing Count in Lee County, AL (NEWLISCOU1081), Realtor.com via FRED, June 2026
- Housing Inventory: Median Days on Market in Lee County, AL (MEDDAYONMAR1081), Realtor.com via FRED, June 2026
- Housing Inventory: Price Reduced Count in Lee County, AL (PRIREDCOU1081), Realtor.com via FRED, June 2026
- Median Listing Price per Square Feet in Auburn-Opelika, AL (MEDLISPRIPERSQUFEE12220), Realtor.com via FRED, June 2026
- Median Listing Square Feet in Lee County, AL (MEDSQUFEE1081), Realtor.com via FRED, June 2026
- 30-Year Fixed Rate Mortgage Average (MORTGAGE30US), Freddie Mac Primary Mortgage Market Survey, week ending July 30, 2026
- Total Enrollment Quick Facts, Auburn University Office of Institutional Research, Fall 2025